Flame Graph and stack trace visualization
A stack trace is series of functions which show the code path. With the Linux perf(1) tool, the stack samples are summarized as call tree. With the BCC profile(8) tool, the unique stack trace shows as a count. Both tools are very useful when there are only a few call stacks on-CPU. However, when the profiling result includes a huge number of stacks, looking through pages of stack output would not be that easy. Flame graphs were invented to solve this problem.
The following is a synthetic example for easier explanation of Flame Graph.
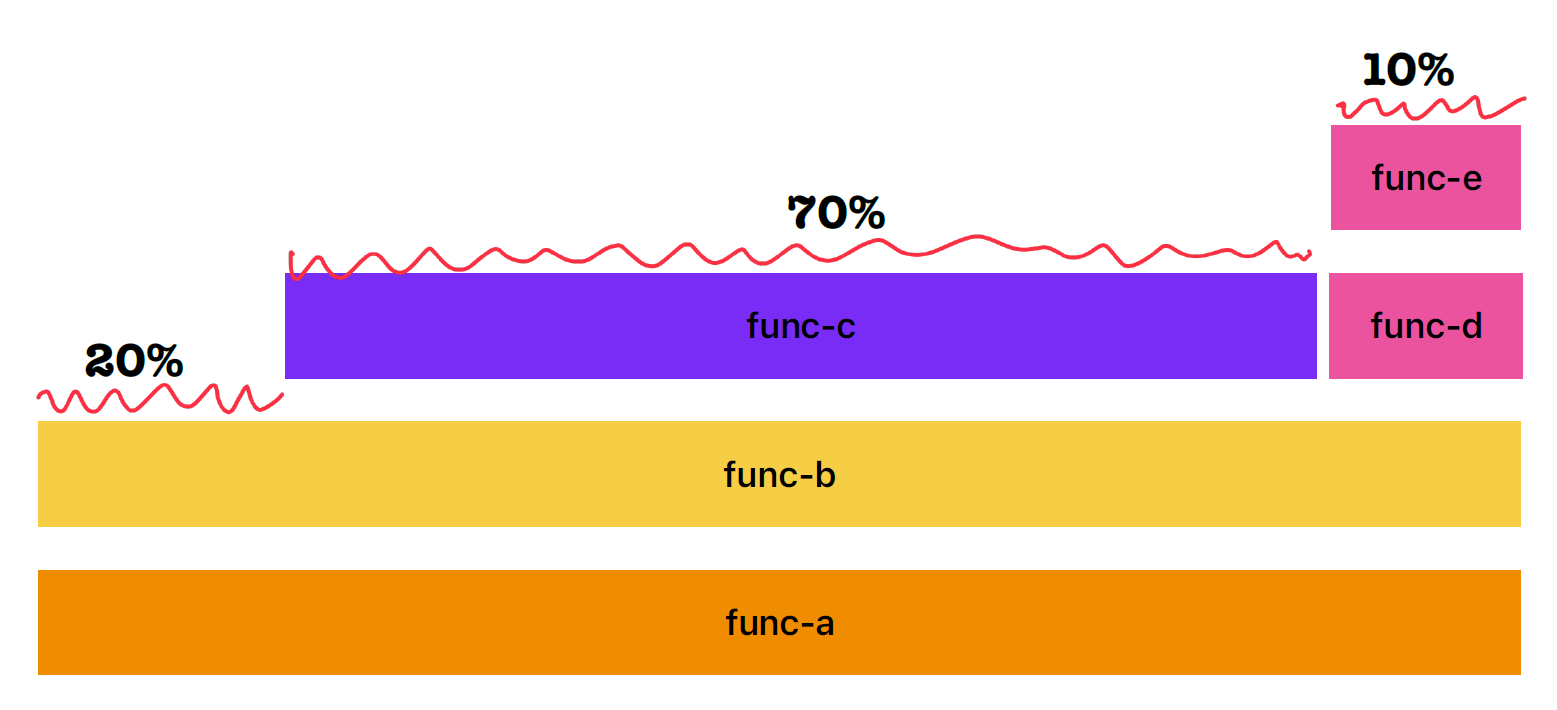
From this Flame Graph, three call stacks are included:
- func-a -> func-b
- func-a -> func-b -> func-c
- func-a -> func-b -> func-d -> func-e
From left to right, it’s an alphabetical sort of function frames. Each box represents a function in the stack(aka “stack frame”). The width of the box reflects the presence in the profile.
From bottom to top, it represents the code flow.
The Flame Graph shows the CPU samples, which means the top edge represents the functions running on-CPU. The other function below the top edge are never sampled on-CPU directly.
In the above example Flame Graph, the func-c was directly on-CPU for 70% of the time, func-b was on-CPU for 20% of time, and func-e was on-CPU for 10% of the time during sampling.
Even though the functions below the top edge are not directly on-CPU durng sampling, it still helps determine the function ancestry.
So, to read a Flame Graph, we can look for the widest towers and understand them first since they consume much CPU cycles during sampling.
The following is a real example of Flame Graph.
