Analyze Cockroach performance from the built-in DB console
In this post, we try to understand how to analyze CockroachDB performance by monitoring its built-in DB console.
Problem statement
We have a YCSB workload(insert:read=0.5:0.5) run over single node CockroachDB server. As a result, the insert OPS is 10940 and average latency is ~31.3ms per operation. We notice that the backend NVME disk I/O latency is less than 1ms, which is fast enough to handle the I/Os. A question is which component introduces the extra ~30ms latency for each insert operation? We also notice that the CockroachDB consumes ~50% CPU in user space. So, we want to dig more about the CockroachDB behaviors by leveraging its DB console.
INSERT - Takes(s): 4517.6, Count: 49423144, OPS: 10940.0, Avg(us): 31295, Min(us): 1080, Max(us): 61951, 99th(us): 59583, 99.9th(us): 61663, 99.99th(us): 61919
READ   - Takes(s): 4517.7, Count: 49892329, OPS: 11043.9, Avg(us): 2640, Min(us): 351, Max(us): 33887, 99th(us): 16527, 99.9th(us): 29887, 99.99th(us): 33535
DB console access
The DB Console provides details about the CockroachDB cluster and database configuration, and helps optimize cluster performance.
You can access the DB Console from every node at http://[host]:[http-port], or http://[host]:8080 by default.
Overview
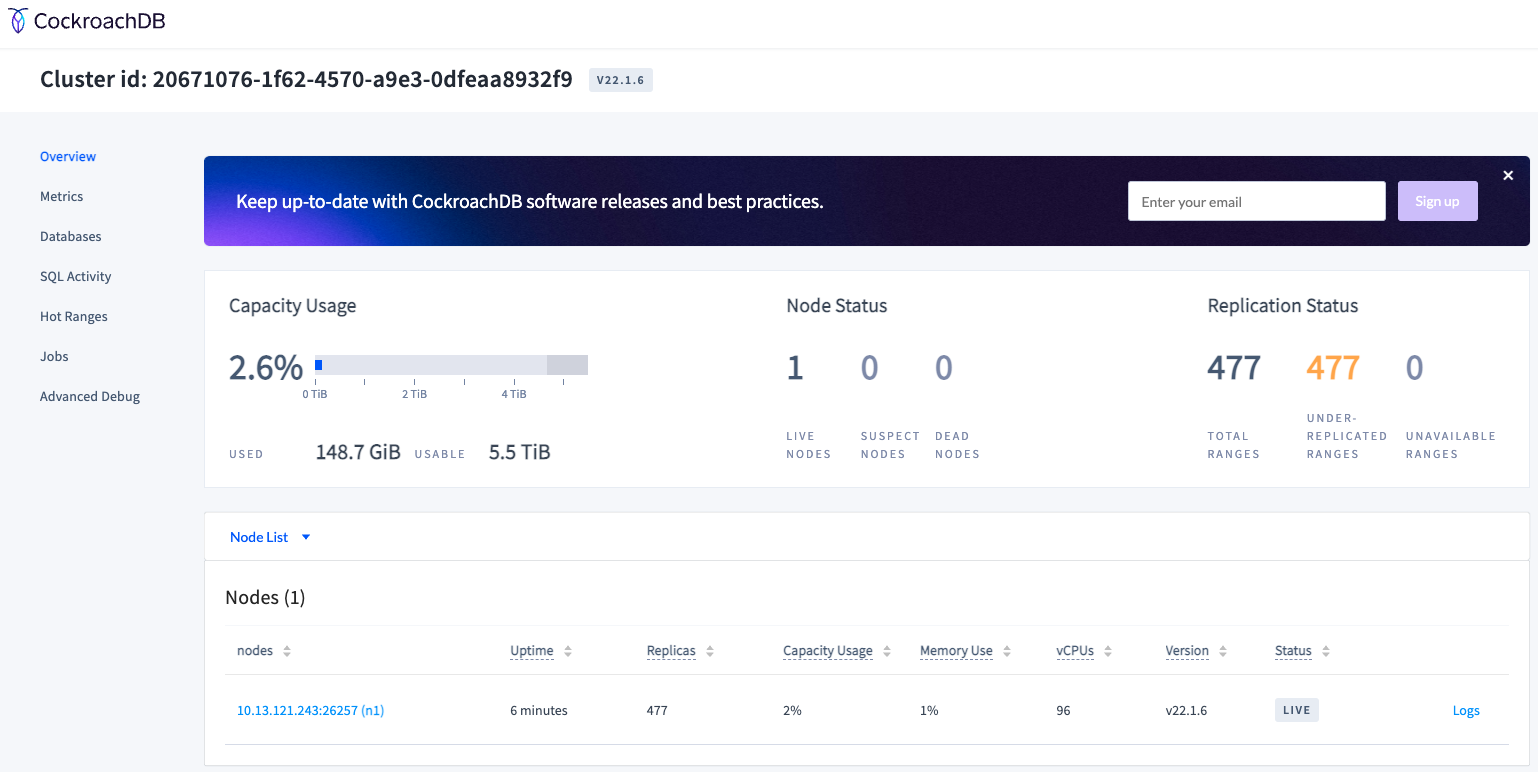
In the Overview page, we know that it is a single node CockroachDB cluster. The node has 96 CPUs, 2% memory, and 2.6% disk capacity in use. Also, there are 477 CockroachDB range replicas.
Databases
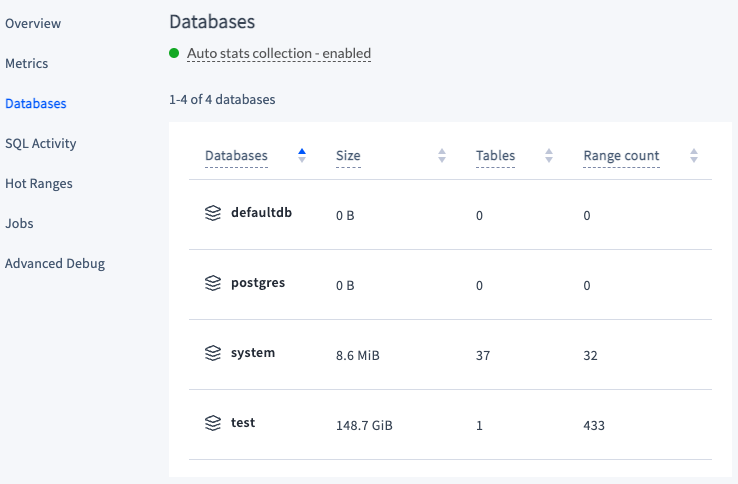
The Databases page shows details about the system and user databases in the cluster.
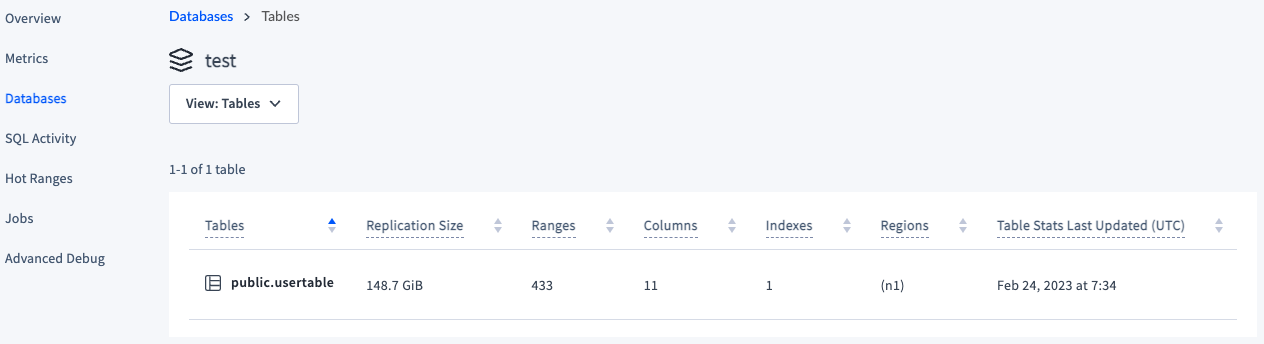
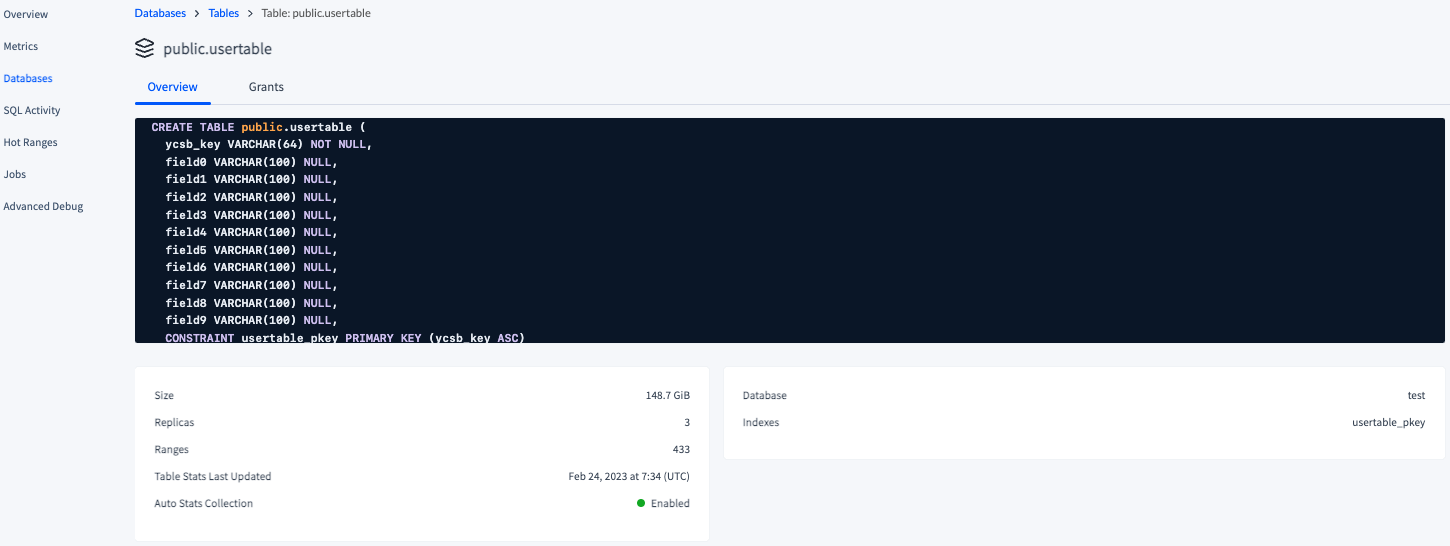
In our case, the database test is used for YCSB benchmark. The database size is 148.7GB and it has one table with 433 ranges. The table is called usertable which has 11 columns. There is one index created on the table.
SQL Activity
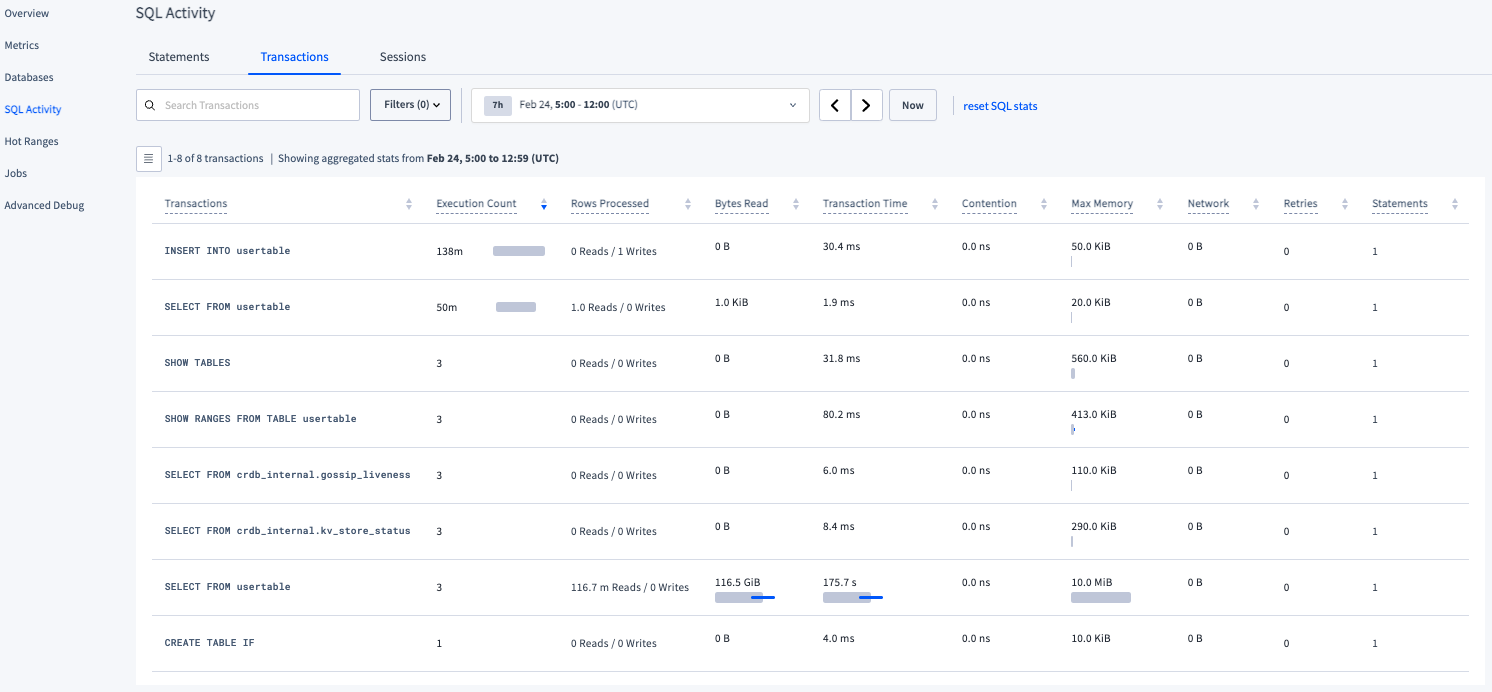
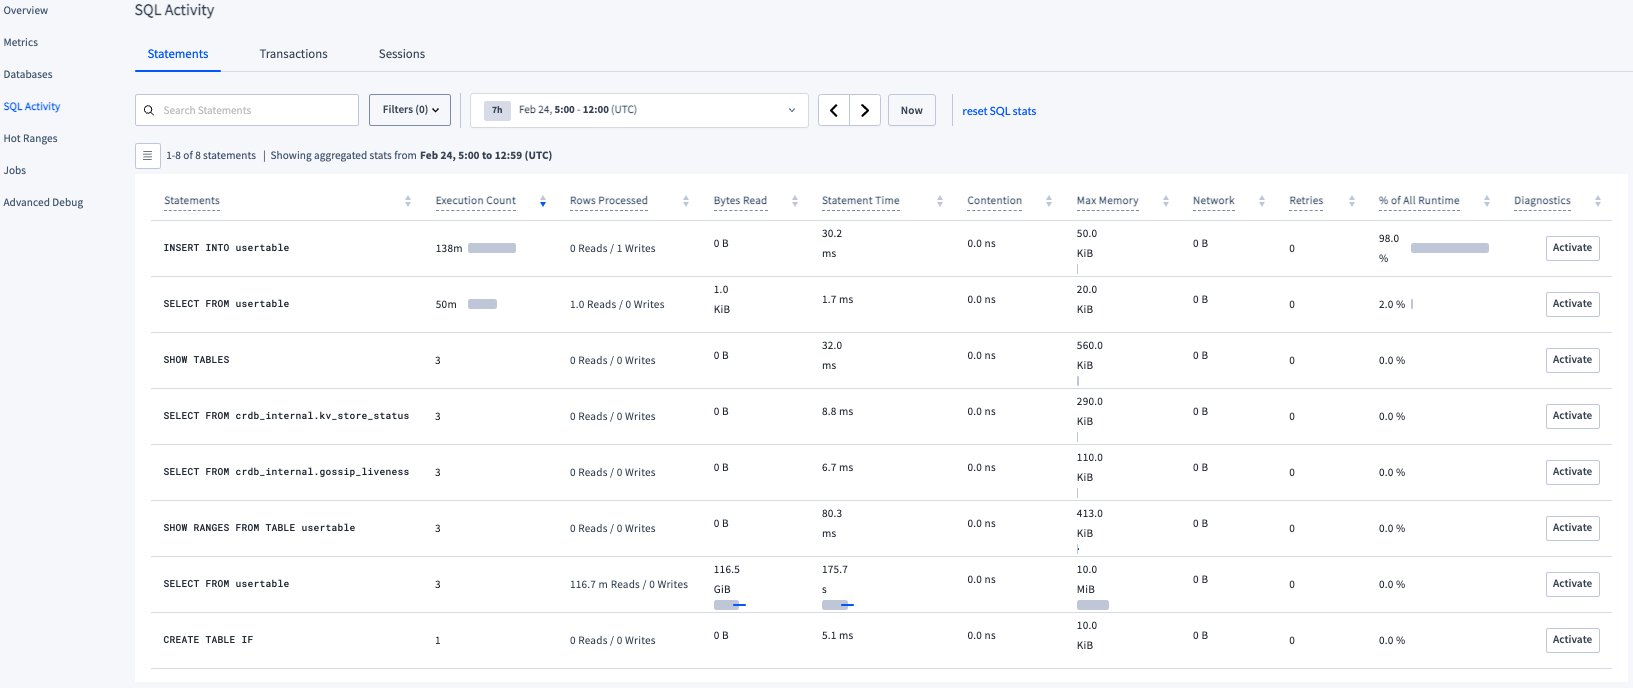
The SQL Activity page summarizes SQL activity in the cluster. Transactions(Statements) shows frequently executed and high-latency SQL transactions(statements).
In our case, there are 138M insert and 50M select transactions. There are more inserts than selects because we had initial database load operations which insert 100M records to the table. After that, we ran YCSB workload with the insert to read ratio “0.5:0.5”.
Furthermore, the transaction time for the “Insert into usertable” is 30.4ms. The SQL statement time is 30.2ms for this transaction. This helps explain why the average YCSB operation latency is ~31.3ms. The major overhead is from the insert transaction itself.
Metrics
The Metrics page provides dashboards for all types of CockroachDB metrics.
- Overview dashboard has metrics about SQL performance, replication, and storage.
- Hardware dashboard has metrics about CPU usage, disk throughput, network traffic, storage capacity, and memory.
- Runtime dashboard has metrics about node count, CPU time, and memory usage.
- SQL dashboard has metrics about SQL connections, byte traffic, queries, transactions, and service latency.
- Storage dashboard has metrics about storage capacity and file descriptors.
- Replication dashboard has metrics about how data is replicated across the cluster, e.g., range status, replicas per store, and replica quiescence.
- Distributed dashboard has metrics about distribution tasks across the cluster, including RPCs, transactions, and node heartbeats.
- Queues dashboard has metrics about the health and performance of various queueing systems in CockroachDB, including the garbage collection and Raft log queues.
- Slow requests dashboard has metrics about important cluster tasks that take longer than expected to complete, including Raft proposals and lease acquisitions.
- Changefeeds dashboard has metrics about the changefeeds created across your cluster.
- Overload dashboard has metrics about the performance of the parts of your cluster relevant to the cluster’s admission control system.
TTL dashboard has metrics about the progress and performance of batch deleting expired data using Row-Level TTL from your cluster.
Overview metrics
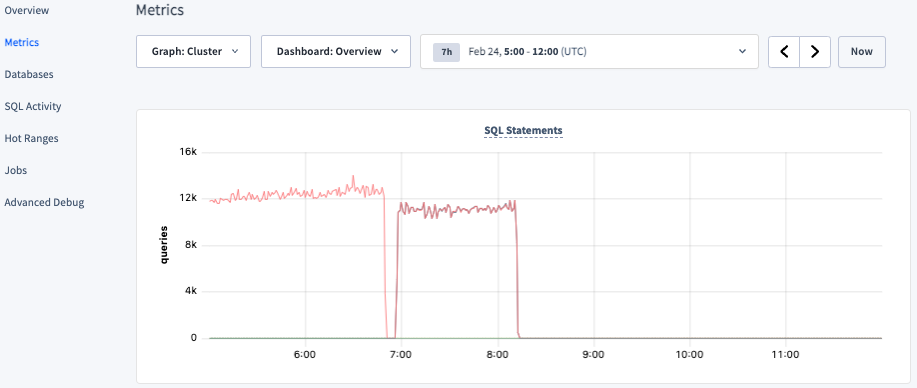
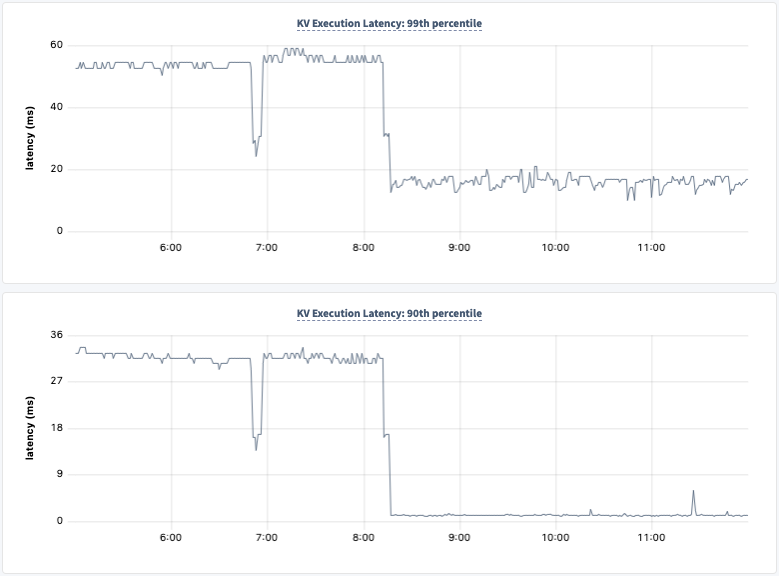
SQL metrics
This shows the KV execution latency(90th and 99th percentile). In our case, the 90th percentile latency is ~31ms for the KV execution. At this point, we know why the CockroachDB introduces the high latency at the application layer. To improve the overall YCSB benchmark performance, changes on CockroachDB layer is needed.
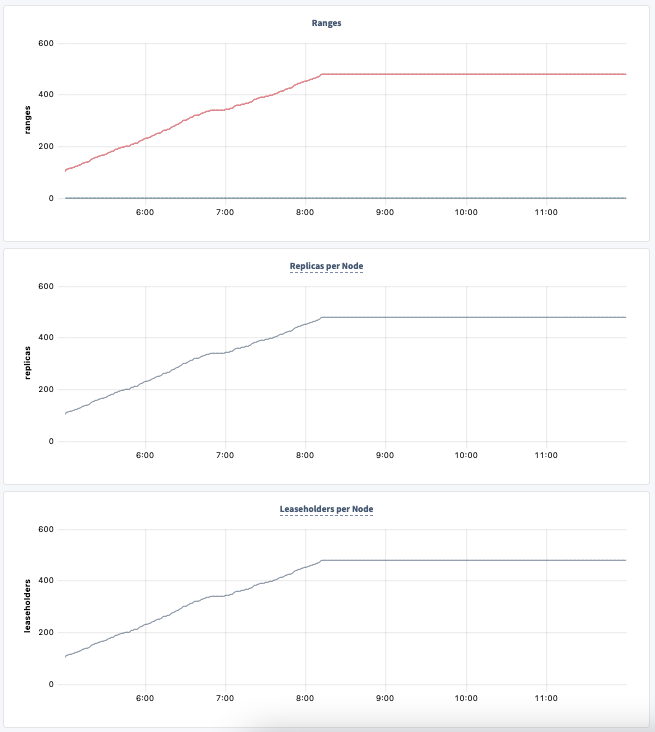
Replication metrics
This shows how the number of range replicas increases significantly during database load time.
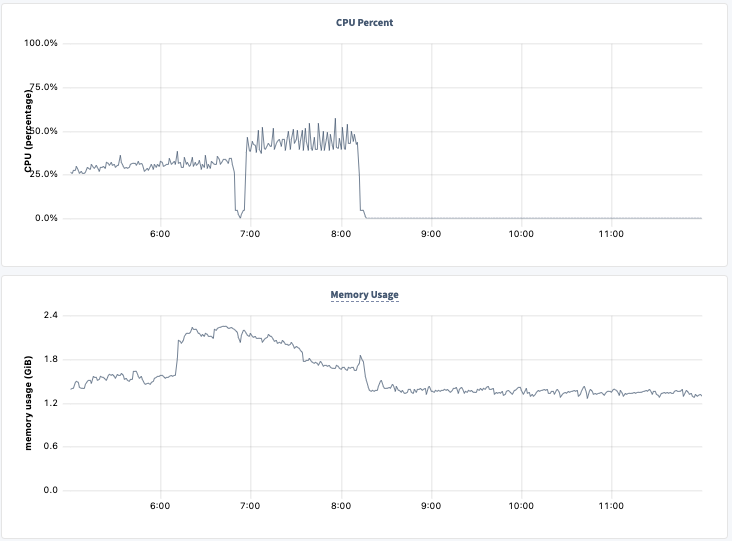
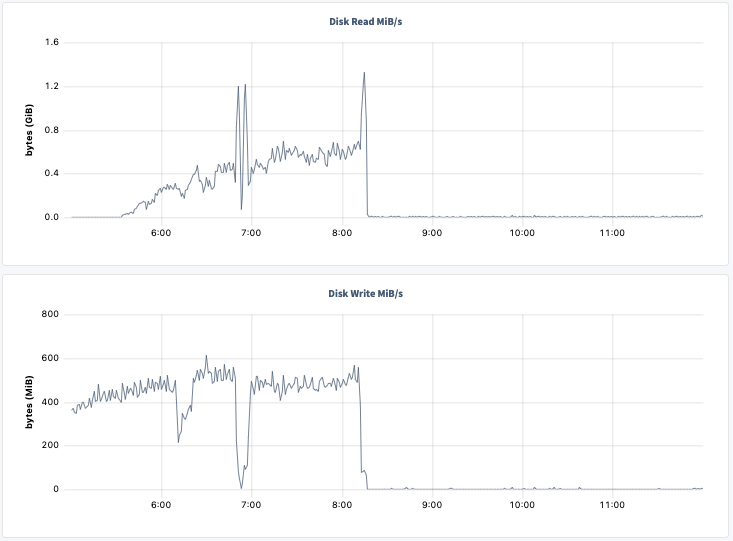
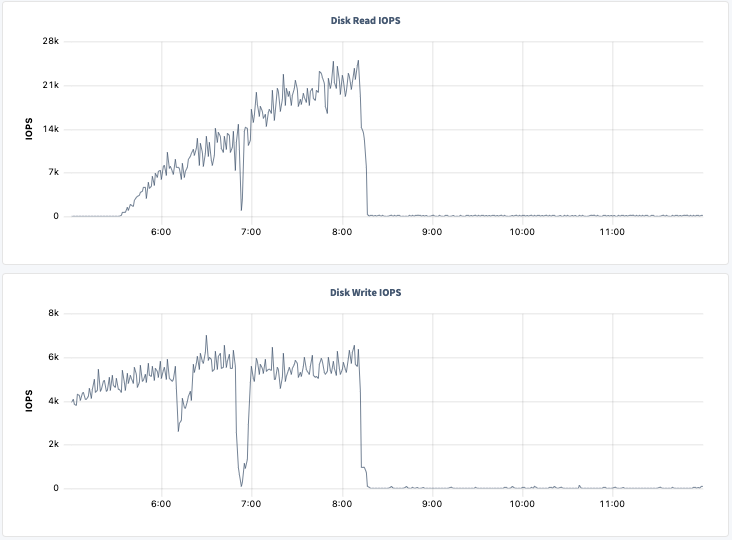
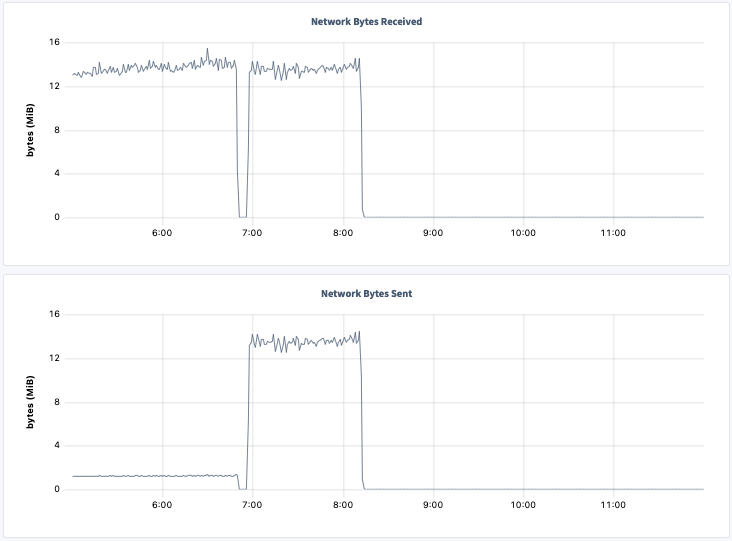
Hardware metrics
The hardware metrics are extremely useful for performance issue analysis. It shows the CPU, Memory, Disk I/O and network bandwidth utilization, which allows us to know if the system performance is limited by hardware or not.
In our case, there is no hardware bottleneck. But we do notice that CockroachDB consumes up to 50% CPU in user space for 96 CPU cores system. From previous analysis, we know each SQL transaction takes a relative long CPU cycle(~30ms) to complete.
I used vmstat and top to identify how much user/kernel CPU are utilized at system level and how much CPU is consumed by CockroachDB process. When YCSB is running, CockroachDB process consumes up to 50% CPU and most of the CPU is in user space.
Summary
This post concludes how to analyze a typical performance issue by making use of the Cockroach DB console. The DB console is production ready to use and shows many useful insight of CockroachDB and system metrics.