Dynamically tracing with user-defined tracepoint in perf
In this post, we are going to explore how to use Perf - The official Linux profiler for dynamic tracing with user-defined tracepoint. When we say dynamic tracing, the kernel event(function) to be traced is not predefined in perf. Instead, we add the tracepoint event manually.
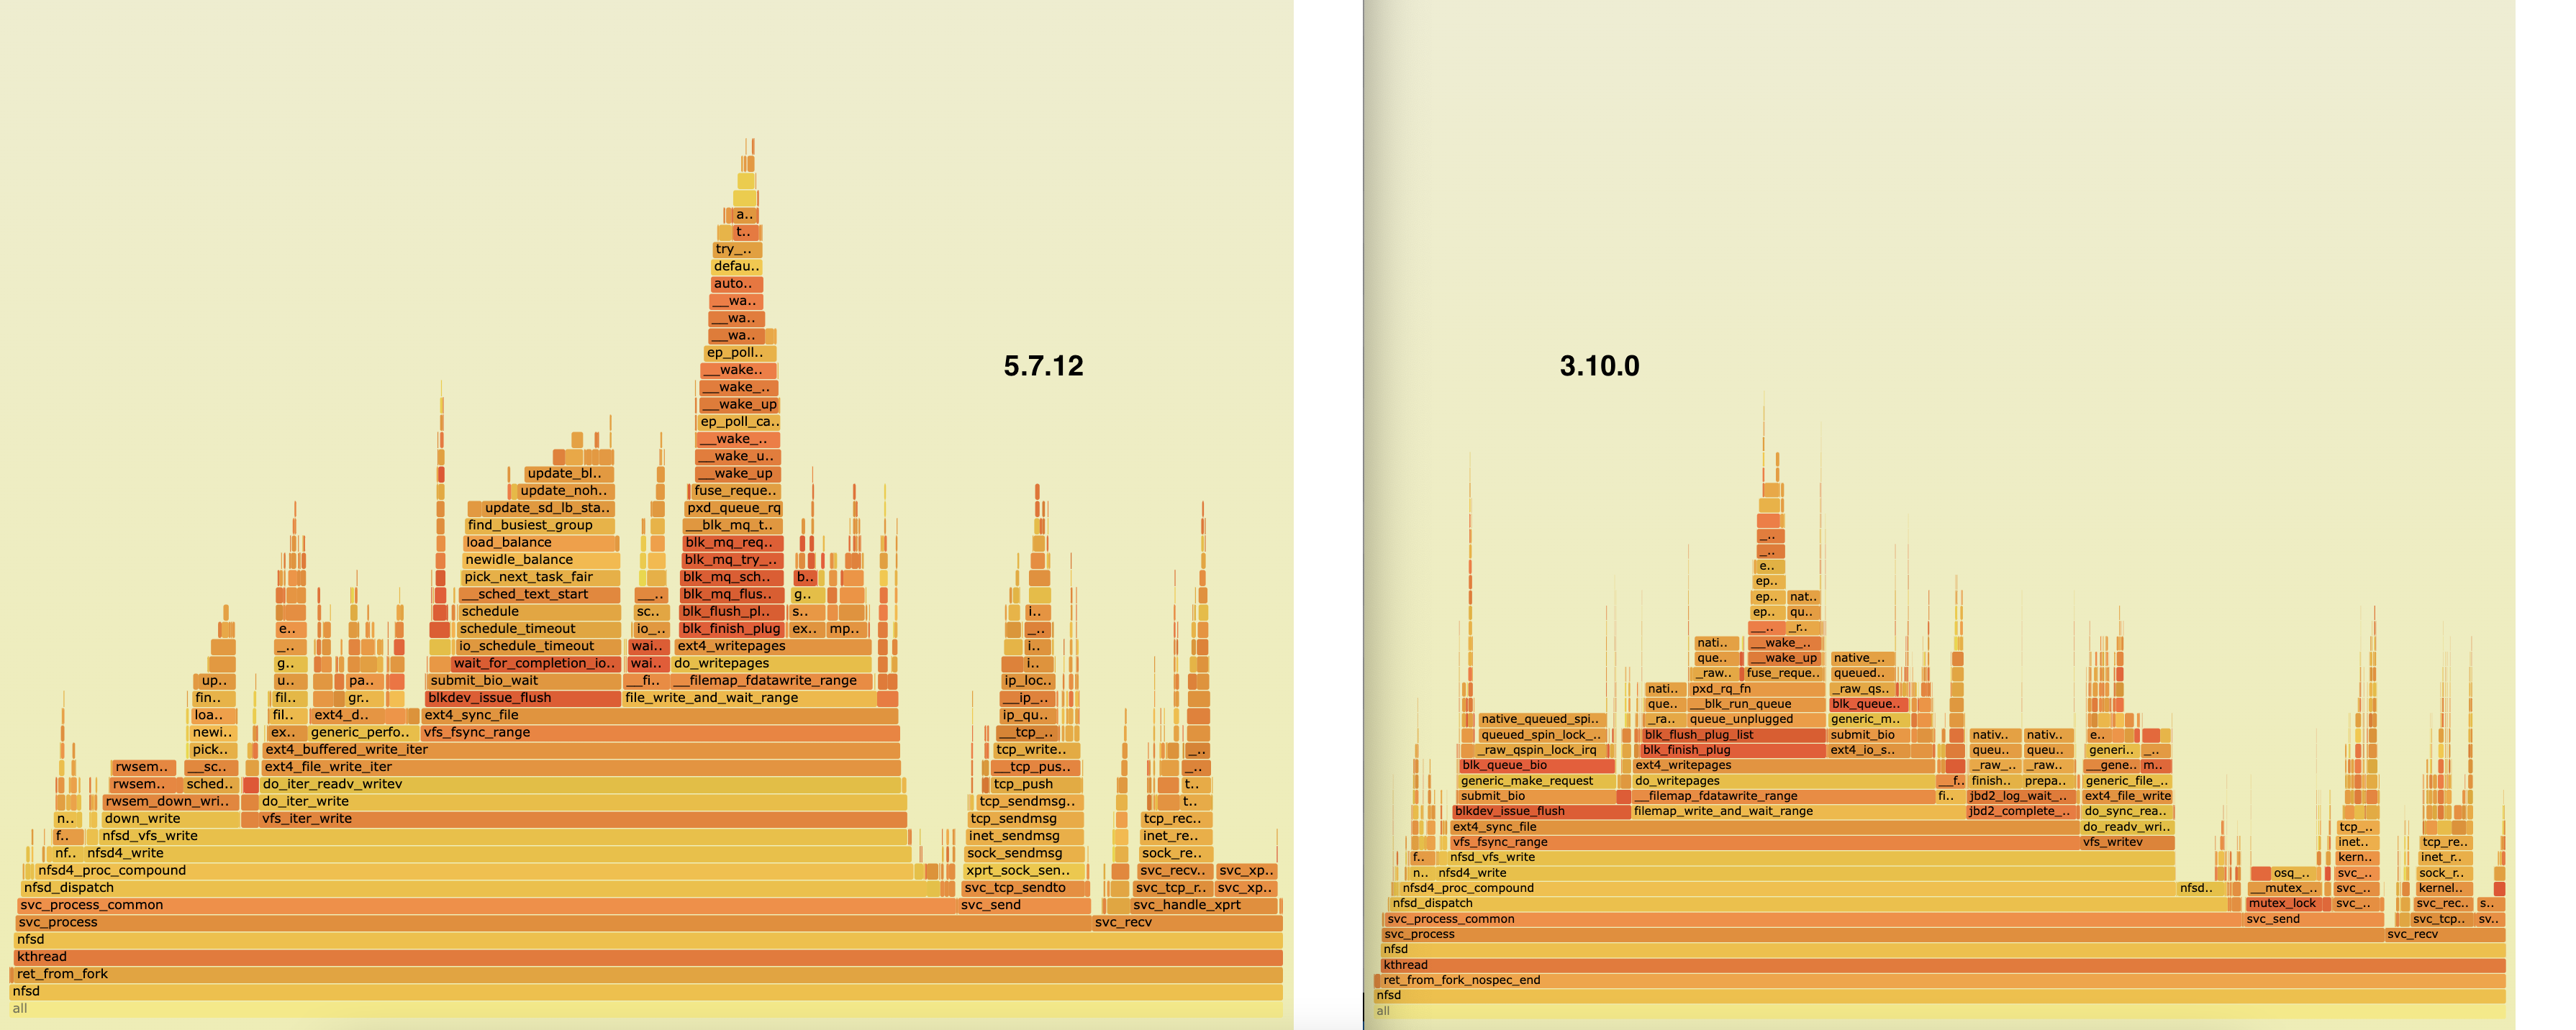
We will study it based on a real world nfs write performance issue. With the 4k sequential write from fio, the throughput is much lower with newer kernel(5.x) compared to older kernel(3.x). By profiling the system, it’s clear to see the call stack and samples of nfsd are very different for the two kernel versions.
Add tracepoint in perf
At first look, I want to add a tracepoint for the kernel function “nfsd_vfs_write” since it appears in the main code path of nfsd for both kernel versions. But perf complains the error of “out of .text” as below.
[root@host1 ~]# perf probe --add nfsd_vfs_write
nfsd_vfs_write is out of .text, skip it.
  Error: Failed to add events. Reason: No such file or directory (Code: -2)
By checking the exported kernel symbols from /proc/kallsyms, the symbol type is lowercase “t” for the function “nfsd_vfs_write”.
[root@host1 ~]# cat /proc/kallsyms |  egrep -i -w "nfsd_vfs_write"
ffffffffc094fdd0 t nfsd_vfs_write	[nfsd]

[root@host1 ~]# perf probe -F | egrep -i "nfsd_vfs_write$"
nfsd_vfs_write
Based on the manual page of nm, lowercase means it is local symbol. It’s likely that the local symbol can’t be added as probe event.
The symbol type.
If lowercase, the symbol is usually local; if uppercase, the symbol is global (external).
“T” “t” The symbol is in the text (code) section.
If we still want to trace and understand the overhead for the function “nfsd_vfs_write”, ftrace is a way to go.
In this post, we want to discuss how to add a probe event in perf. So we try a different function “vfs_fsync_range” whose type is global symbol.
With the following commands, the probe for “vfs_fsync_range” is added to perf.
[root@host1 ~]# uname -r
3.10.0-1160.el7.x86_64
[root@host1 ~]# cat /proc/kallsyms | awk '{if($2=="T")print}' | grep -i vfs_fsync_range
ffffffff960837a0 T vfs_fsync_range

[root@host1 ~]# perf list | grep probe

[root@host1 ~]# perf probe vfs_fsync_range
Added new event:
  probe:vfs_fsync_range (on vfs_fsync_range)

You can now use it in all perf tools, such as:

    perf record -e probe:vfs_fsync_range -aR sleep 1

[root@host1 ~]# perf list | grep probe
  probe:vfs_fsync_range                              [Tracepoint event]
Trace the user-defined probe event
At this point, we had the tracepoint for the function “vfs_fsync_range” added in perf. We are able to sample the stack trace and check the function runtime from perf script output. This can be useful because without the dynamic tracing like this, we can’t identify the overhead(runtime) for the target function. The similar tracing can be done with ftrace. Here we just study how to use perf to dynamically add a tracepoint for sampling in perf. However, based on the experiments, ftrace seems more powerful when to identify the kernel function overhead compared to perf.
The following commands show how to record the stack traces for the target tracepoint and how to extract the call time from it. By comparing the function call time for the differnt kernels, we could identify the possible issue in nfsd call stack.
[root@host1 ~]#  perf record -e probe:vfs_fsync_range -aR sleep 10
[ perf record: Woken up 57 times to write data ]
[ perf record: Captured and wrote 16.284 MB perf.data (233480 samples) ]

[root@host1 ~]# ls -la perf.data
-rw------- 1 root root 17120542 Jul 13 23:50 perf.data

[root@host1 ~]#  perf record -e probe:vfs_fsync_range -g -aR sleep 10
[ perf record: Woken up 146 times to write data ]
[ perf record: Captured and wrote 38.179 MB perf.data (248546 samples) ]

[root@host1 ~]# ls -la perf.data
-rw------- 1 root root 40079506 Jul 13 23:52 perf.data

[root@host1 ~]# perf report --stdio
# To display the perf.data header info, please use --header/--header-only options.
#
#
# Total Lost Samples: 0
#
# Samples: 248K of event 'probe:vfs_fsync_range'
# Event count (approx.): 248546
#
# Children      Self  Trace output
# ........  ........  ..................
#
   100.00%   100.00%  (ffffffff960837a0)
            |
            ---ret_from_fork_nospec_end
               kthread
               nfsd
               svc_process
               svc_process_common
               nfsd_dispatch
               nfsd4_proc_compound
               nfsd4_write
               vfs_fsync_range

[root@host1 ~]# perf script
nfsd  3592 [025]   677.464643: probe:vfs_fsync_range: (ffffffff960837a0)
        ffffffff960837a1 vfs_fsync_range+0x1 ([kernel.kallsyms])
        ffffffffc07a0b0f nfsd4_write+0x1cf ([kernel.kallsyms])
        ffffffffc07a267d nfsd4_proc_compound+0x3dd ([kernel.kallsyms])
        ffffffffc078d810 nfsd_dispatch+0xe0 ([kernel.kallsyms])
        ffffffffc0f61850 svc_process_common+0x400 ([kernel.kallsyms])
        ffffffffc0f61d13 svc_process+0xf3 ([kernel.kallsyms])
        ffffffffc078d16f nfsd+0xdf ([kernel.kallsyms])
        ffffffff95ec5c21 kthread+0xd1 ([kernel.kallsyms])
        ffffffff96593df7 ret_from_fork_nospec_end+0x0 ([kernel.kallsyms])
<...>