Introduction to BPF performance tools
What are BPF and eBPF
BPF stands for Berkeley Packet Filter, which was firstly developed to improve the performance of packet capture tools. It was rewritten later and turned into a general-purpose execution engine including the creation of performance analysis tools.
BPF allows the kernel to run mini programs on system and application events, such as disk I/O. It makes the kernel fully programmable, empowering users(even non-kernel developers) to customize and control the system in order to solve real-world problems.
Extended BPF is abbreviated as eBPF. Since the classic BPF is no longer developed, the kernel contains only one execution engine, BPF(eBPF), to run both extended BPF and classic BPF programs.
What are tracing, snooping, sampling and profiling
Tracing is event based recording. BPF tools uses this type of instrumentation. You might be familiar with some Linux tracing tools. For example, strace records and prints system calls. tcpdump is another tracing tool for network packets.
There are many ready-to-use BPF tools after you install BCC. Some of them are snooping tools. It just a differnt naming. It’s actually event based tracing.
$ ls /usr/share/bcc/tools/| grep snoop
bindsnoop biosnoop compactsnoop dcsnoop drsnoop execsnoop exitsnoop killsnoop mountsnoop opensnoop shmsnoop sofdsnoop statsnoop syncsnoop threadsnoop ttysnoop
Sampling tools take a subset of measurements which gives a coarse picture of the target system. It is also known as profiling. It’s usually timer(frequency) based. For example, 100 samples can be taken every second per CPU. Obviously, the overhead is generally lower than event-based tracing. However, a disadvantage is the sampling would miss events.
What are BCC and bpftrace
Both BCC and bpftrace are front ends which have been developed for tracing based on BPF technology.
BCC was the first tracing framework developed for BPF. It provides C programming environment for writing kernel BPF code and other languages for the user-level interface like python, Lua and C++. BCC is better suited for complex scripts and daemons. It can make use of other libraries. To get started with BCC, refer to this post.
bpftrace is a newer front end for developing BPF tools.It is ideal for powerful one-liners and custom short script. To get started with bpftrace, refer to this post.
BCC and bpftrace live in a Linux Foundation project on github called IO Visor.
BPF tracing visibility
BPF tracing gives you the visibility across the full software stack and allows new tools to be created on demand.
Thanks to Brendan Gregg who annotated with BPF-based performance tools to observe different components across the system software stack as below.
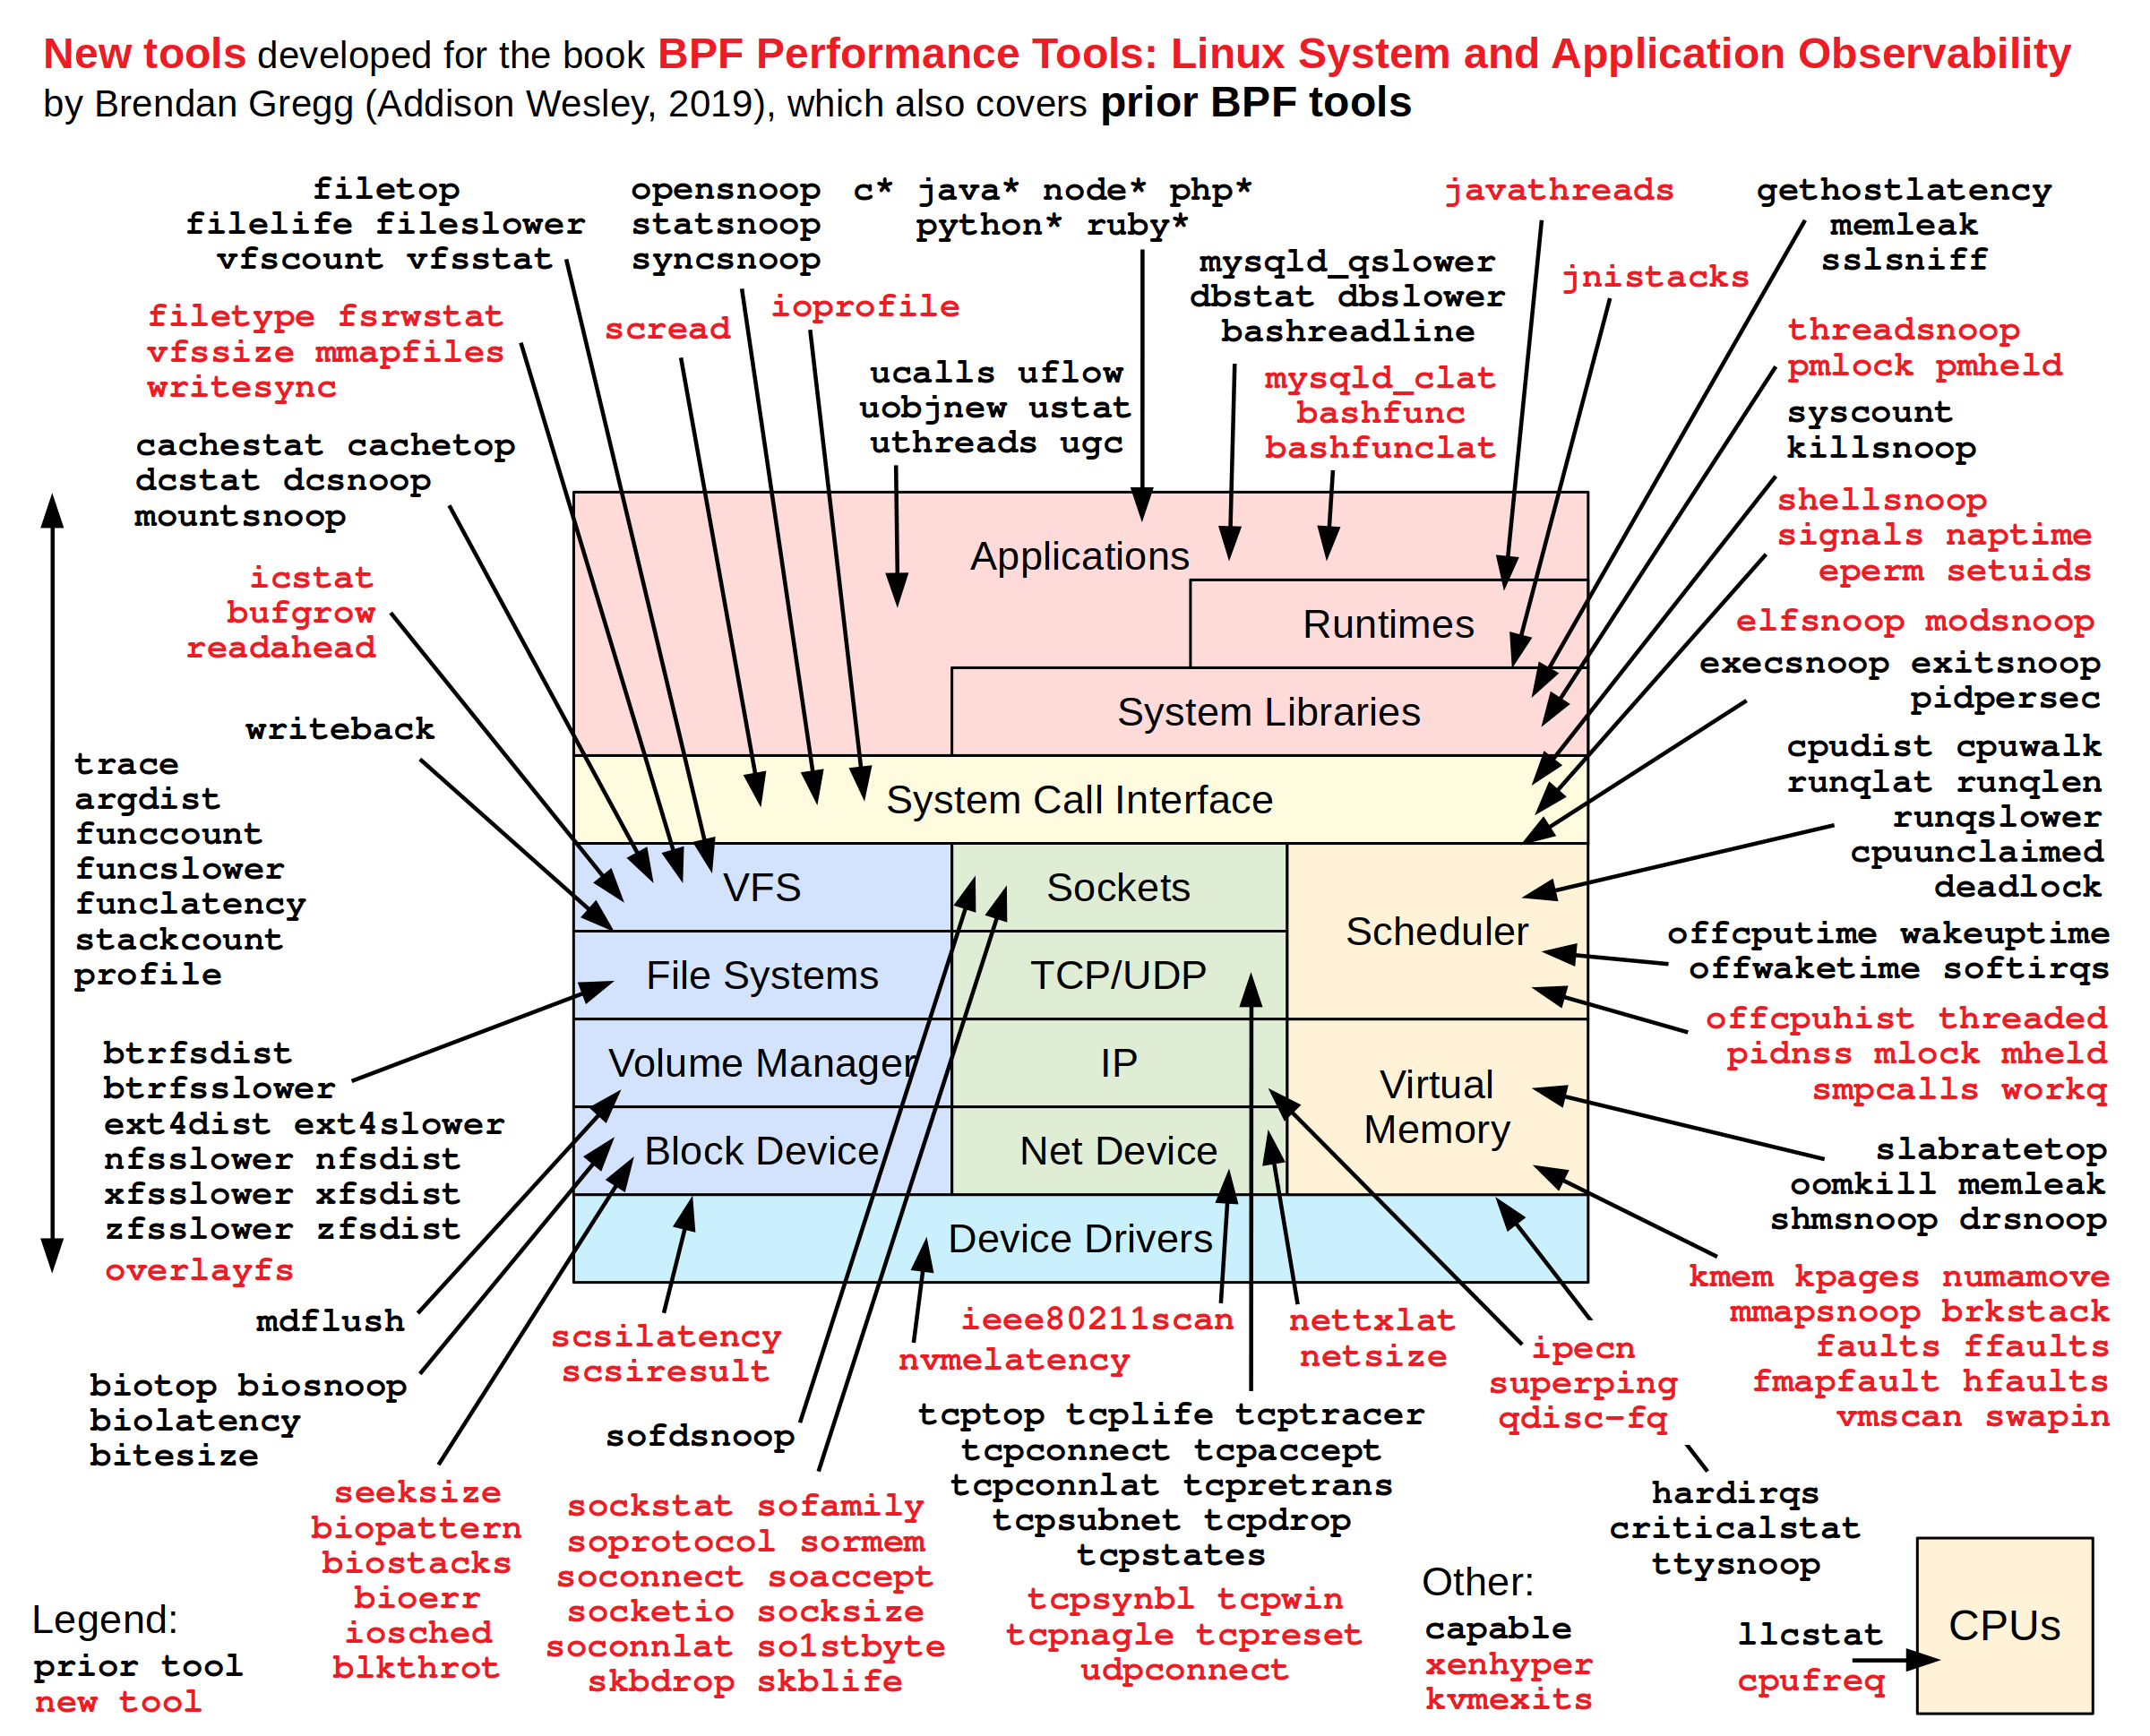
In the past, I used traditional tools like perf, strace, ftrace and systemtap for the system tracing and profiling. I’m interested in learning more about these BPF tracing tools in future.
Dynamic instrumentation: kprobes and uprobes
BPF tracing supports multiple sources of events to provide visibility of the entire software stack.
Dynamic instrumentation(also calledd Dynamic tracing) provides the ability to insert instrumentation points into software. It’s often used by BPF tools to instrument the start and end of the kernel and application functions. BPF tracing tools use both kprobes and uprobes for dynamic instrumentation.
For example,
- kprobe:vfs_read
- kretprobe:vfs_read
- uprobe:/bin/bash:readline
- uretprobe:/bin/bash:readline
Static instrumentation: tracepoints and USDT
A downside for dynamic instrumentation is the instruments functions can be renamed or removed from one software version to the next. This is interface stability issue. Static instrumentation comes with more stable events(functions) which are more well maintained by developers. Of course, this will become a maintenance burden for developers. So, the number of static instrumentation should be limited.
BPF supports tracepoints for kernel static instrumentation and USDT for user-level static instrumentation. For example,
- tracepoint:syscalls:sys_enter_open
- usdt:/usr/sbin/mysqld:mysql:query__start
Summary
This post introduces BPF tracing technology and its front ends BCC and bpftrace at high level. Dynamic and static instrumentation(tracing) can be used for performance analysis and troubeshooting.
We will dive into these technologies in future posts.
Reference
- BPF Performance Tools by Brendan Gregg