How to setup the Grafana and Prometheus dashboard
Install node-exporter on each target nodes
$ docker run --restart=always --name nd-export -d -p 9100:9100 -v /proc:/host/proc -v /sys:/host/sys -v /:/rootfs:ro,rslave --net=host quay.io/prometheus/node-exporter
$ docker ps -a
CONTAINER ID   IMAGE                              COMMAND                CREATED          STATUS          PORTS     NAMES
d8c7fc8a4e40   quay.io/prometheus/node-exporter   "/bin/node_exporter"   32 minutes ago   Up 32 minutes             nd-export
Deploy Prometheus on a VM
$ vim /etc/prometheus/prometheus.yml
global:
scrape_configs:
  - job_name: 'node'
    scrape_interval: 10s
    static_configs:
     - targets: ['localhost:9100','host1-ip:9100','host2-ip:9100','host3-ip:9100','host4-ip:9100']

$ docker run --restart=always --name prometheus -d -p 9090:9090 -v /etc/prometheus:/etc/prometheus prom/prometheus:v1.8.2

$ docker ps -a
CONTAINER ID   IMAGE                              COMMAND                  CREATED          STATUS          PORTS                                       NAMES
3700700b61c9   prom/prometheus:v1.8.2         "/bin/prometheus -co…"   57 minutes ago   Up 22 minutes   0.0.0.0:9090->9090/tcp, :::9090->9090/tcp   prometheus
Verify the Prometheus by accessing http://vm-ip:9090/targets. You should be able to see the target nodes from the web UI.
Deploy Grafana on a VM
$ docker run --restart=always --name grafana -d -p 3000:3000 grafana/grafana

$ docker ps -a
CONTAINER ID   IMAGE                              COMMAND                  CREATED          STATUS          PORTS                                       NAMES
da48a274ecc0   quay.io/prometheus/node-exporter   "/bin/node_exporter"     27 minutes ago   Up 27 minutes                                               nd-export
814511410bff   grafana/grafana                    "/run.sh"                57 minutes ago   Up 57 minutes   0.0.0.0:3000->3000/tcp, :::3000->3000/tcp   grafana
3700700b61c9   prom/prometheus:v1.8.2             "/bin/prometheus -co…"   57 minutes ago   Up 22 minutes   0.0.0.0:9090->9090/tcp, :::9090->9090/tcp   prometheus
Configure the Promethous data source in Grafana
Login to the Grafana web UI by accessing http://vm-ip:3000/. The default username and password is admin/admin.
On the left corner, click “Add sources”.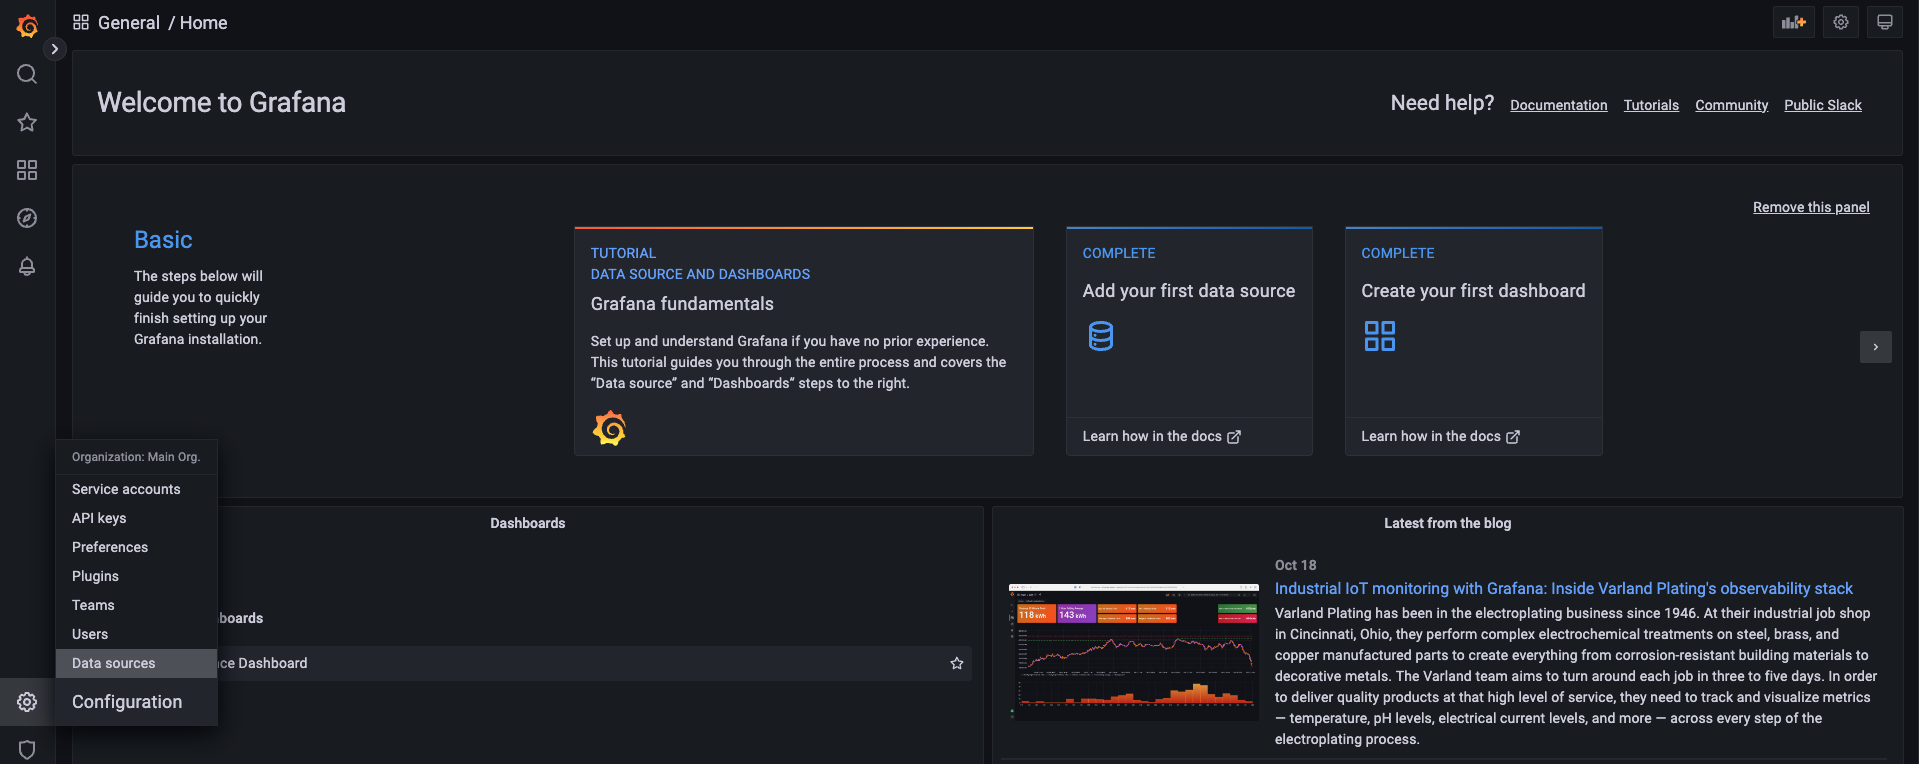
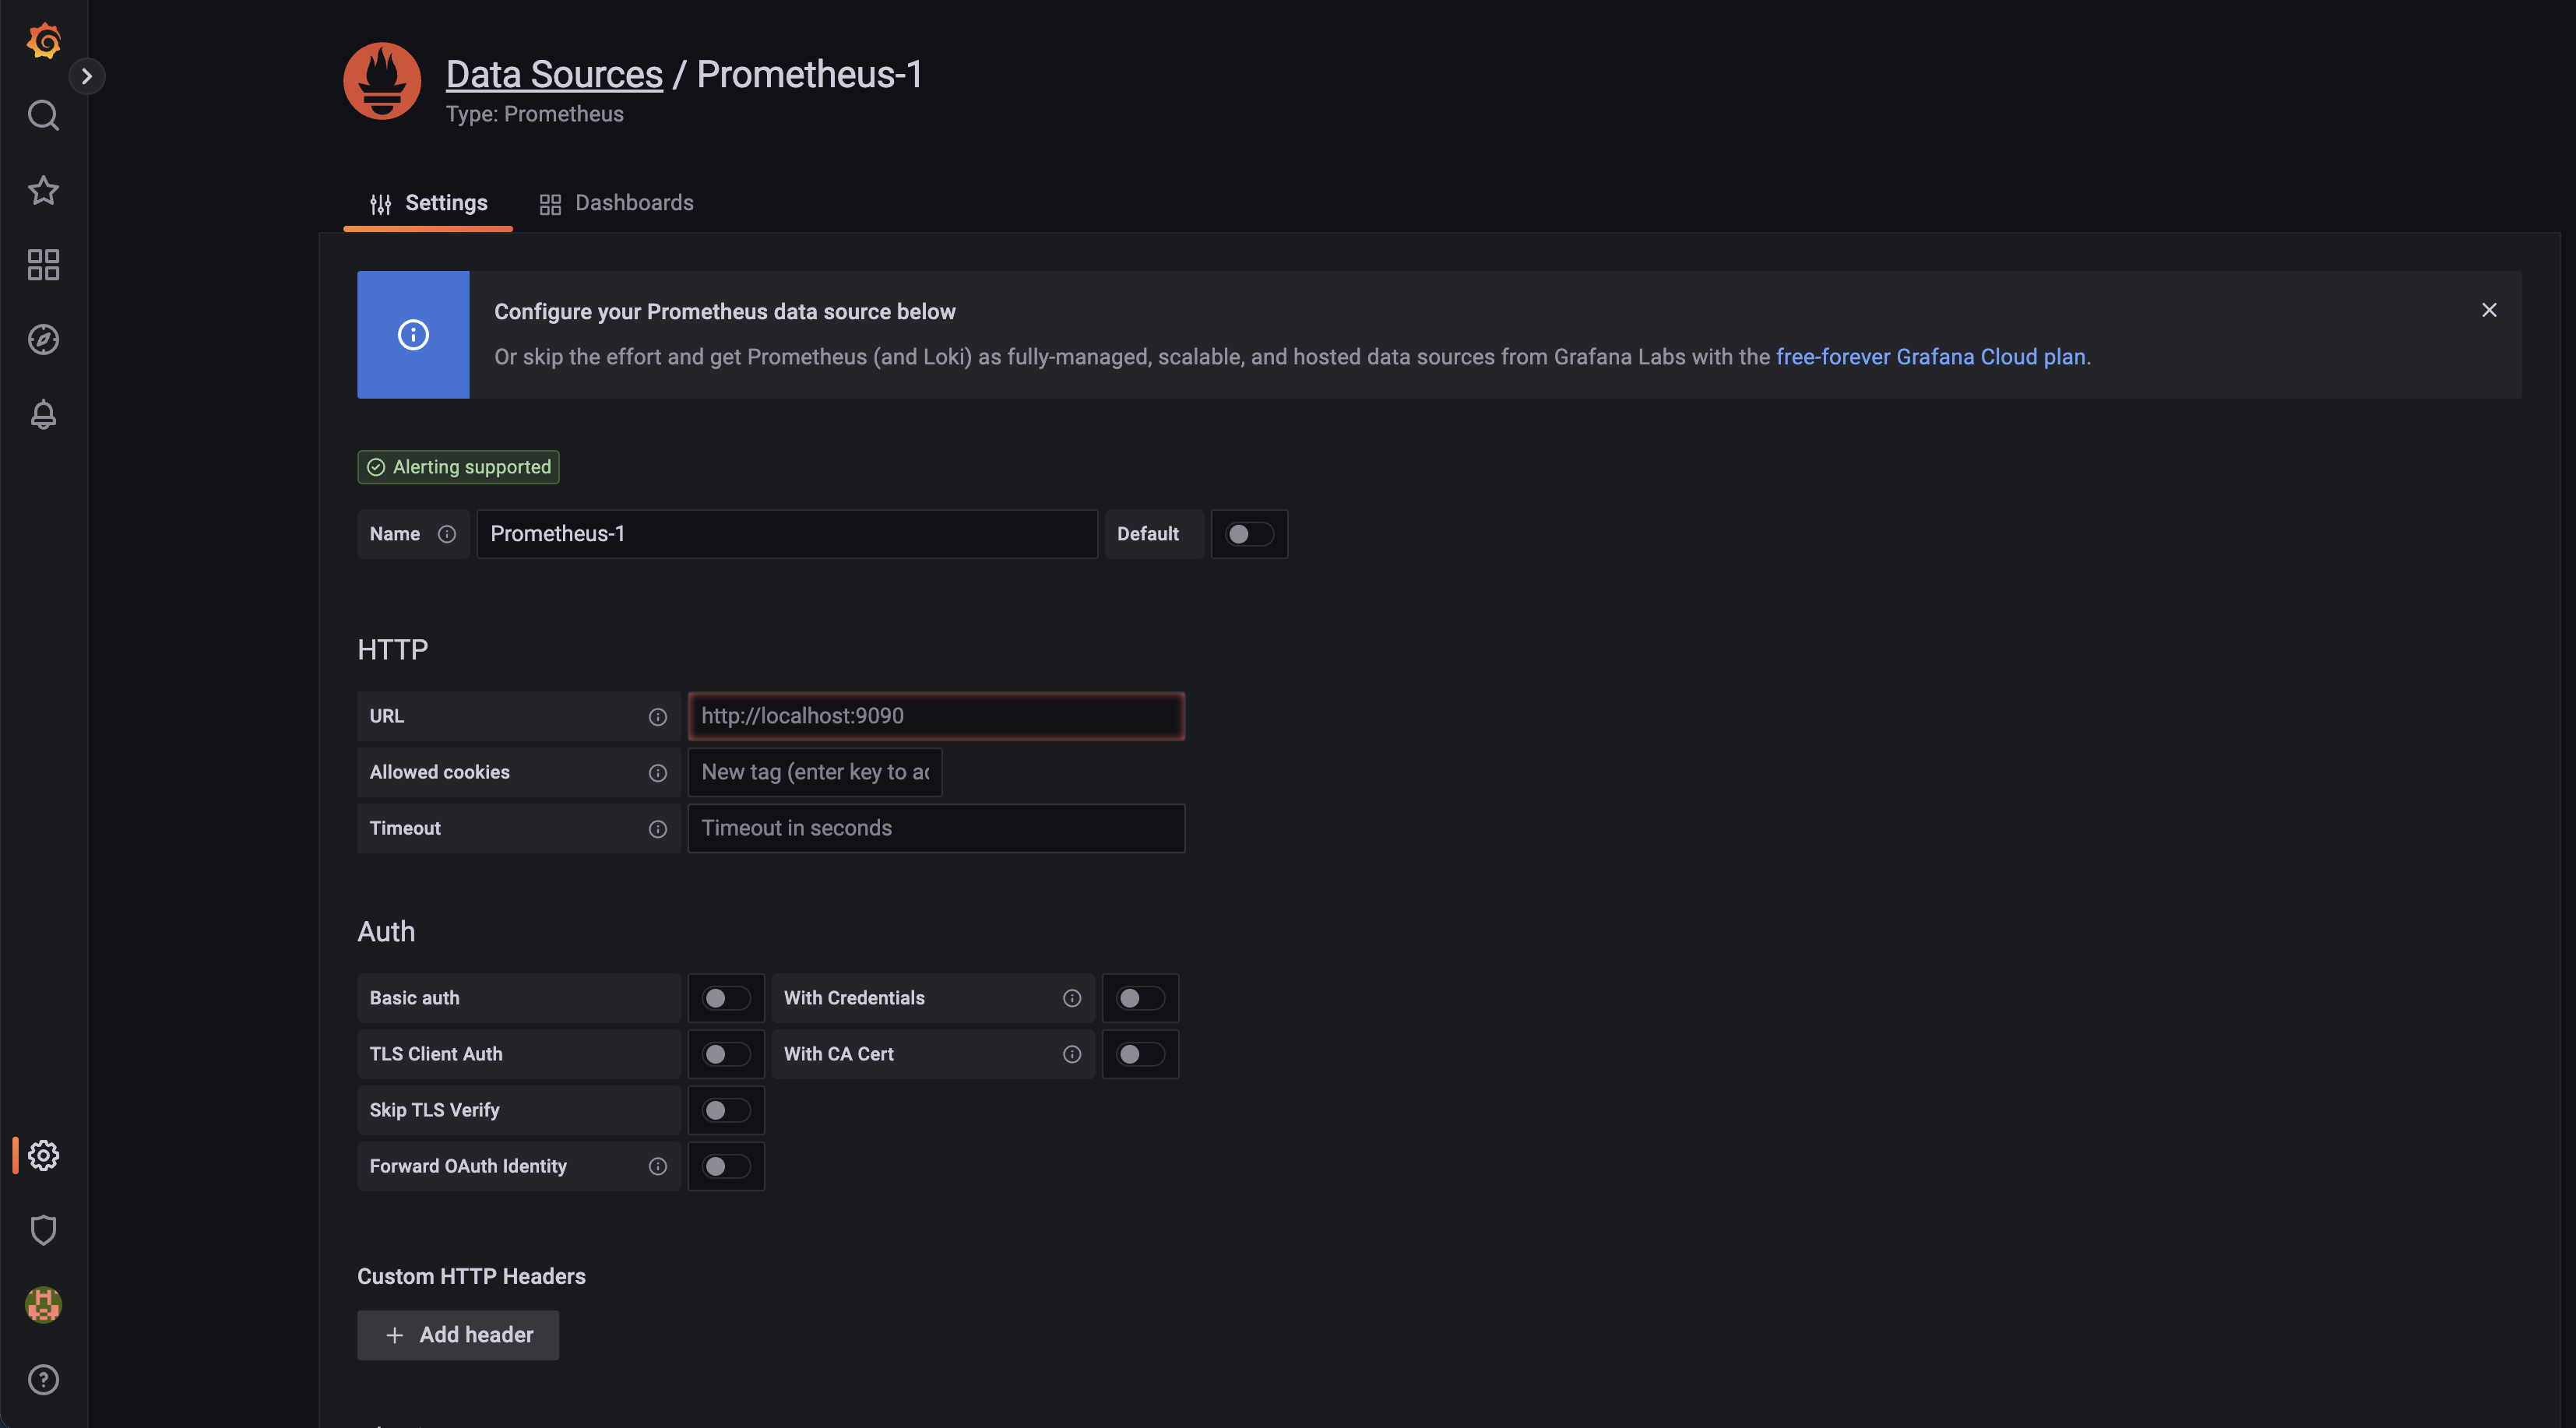
Then add “Prometheus” as data source and fill in the prometheus data source name and the URL. Click Save & test. The data source name will be used when you create the Grafana dashboard later.
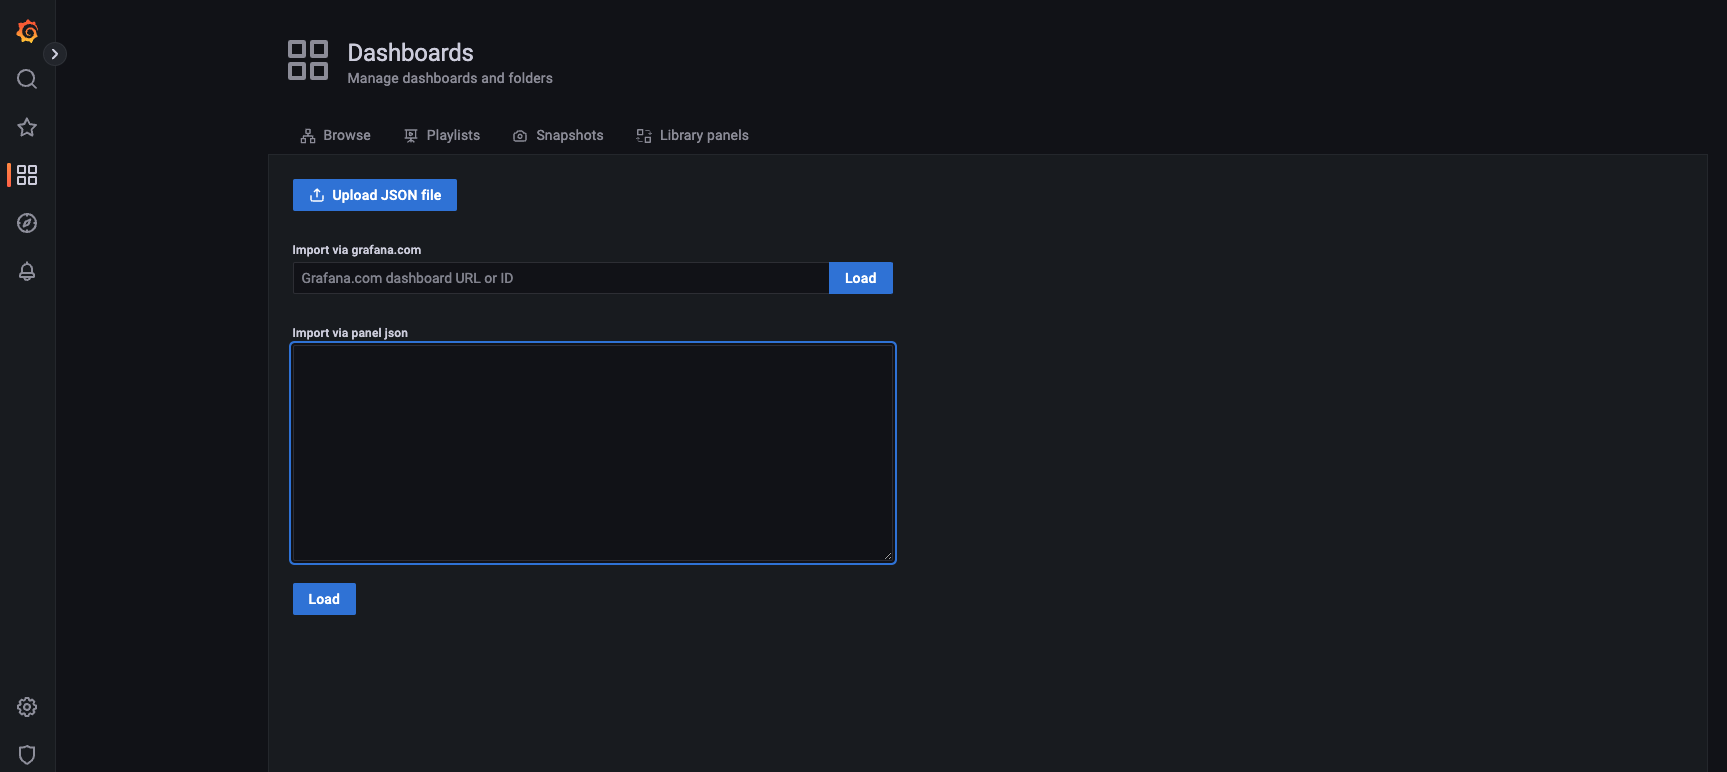
Create the Grafana dashboard
The Grafana dashboard can be created by importing an json template and binding to the previous prometheus data source.