Getting started with Elasticsearch and Kibana
Install elasticsearch
Add user for elasticsearch
[root@vm1 home]# groupadd es
[root@vm1 home]# useradd es -g es
[root@vm1 home]# passwd es
[root@vm1 home]# cd es
Download elasticsearch
[root@vm1 es]# wget https://artifacts.elastic.co/downloads/elasticsearch/elasticsearch-8.4.3-linux-x86_64.tar.gz
[root@vm1 es]# tar zxf elasticsearch-8.4.3-linux-x86_64.tar.gz
[root@vm1 es]# chown -R es:es /home/es
[root@vm1 es]# su es
[es@vm1 ~]$ cd elasticsearch-8.4.3/
Start elasticsearch
[es@vm1 elasticsearch-8.4.3]$ bin/elasticsearch
[...]
[2022-10-17T17:07:49,984][INFO ][o.e.h.AbstractHttpServerTransport] [vm1] publish_address {127.0.0.1:9200}, bound_addresses {[::]:9200}
[...]

✅ Elasticsearch security features have been automatically configured!
✅ Authentication is enabled and cluster connections are encrypted.

ℹ️  Password for the elastic user (reset with `bin/elasticsearch-reset-password -u elastic`):
  [...]

ℹ️  HTTP CA certificate SHA-256 fingerprint:
  [...]

ℹ️  Configure Kibana to use this cluster:
• Run Kibana and click the configuration link in the terminal when Kibana starts.
• Copy the following enrollment token and paste it into Kibana in your browser (valid for the next 30 minutes):
  [...]

ℹ️  Configure other nodes to join this cluster:
• On this node:
  ⁃ Create an enrollment token with `bin/elasticsearch-create-enrollment-token -s node`.
  ⁃ Uncomment the transport.host setting at the end of config/elasticsearch.yml.
  ⁃ Restart Elasticsearch.
• On other nodes:
  ⁃ Start Elasticsearch with `bin/elasticsearch --enrollment-token <token>`, using the enrollment token that you generated.
Verify elasticsearch
[root@vm2 es]# curl 10.10.10.1:9200
curl: (52) Empty reply from server
Modify elastic config file:
[es@vm1 elasticsearch-8.4.3]$ vim config/elasticsearch.yml
# By default Elasticsearch is only accessible on localhost. Set a different
# address here to expose this node on the network:
#
#network.host: 192.168.0.1
network.host: 10.10.10.1

# Enable security features
xpack.security.enabled: false
Restart elasticsearch process and verify again:
[root@vm2 es]# curl 10.10.10.1:9200
{
  "name" : "vm1",
  "cluster_name" : "elasticsearch",
  "cluster_uuid" : "ZZ_MBiS5Qi-3RFSdyk_-Kg",
  "version" : {
    "number" : "8.4.3",
    "build_flavor" : "default",
    "build_type" : "tar",
    "build_hash" : "42f05b9372a9a4a470db3b52817899b99a76ee73",
    "build_date" : "2022-10-04T07:17:24.662462378Z",
    "build_snapshot" : false,
    "lucene_version" : "9.3.0",
    "minimum_wire_compatibility_version" : "7.17.0",
    "minimum_index_compatibility_version" : "7.0.0"
  },
  "tagline" : "You Know, for Search"
}
Install Kibana
Download Kibana
[root@vm2 es]# wget https://artifacts.elastic.co/downloads/kibana/kibana-8.4.3-linux-x86_64.tar.gz
[root@vm2 es]# tar zxf kibana-8.4.3-linux-x86_64.tar.gz
[root@vm2 es]# cd kibana-8.4.3/
[root@vm2 kibana-8.4.3]# chown -R es:es /home/es
Start Kibana
[root@vm2 kibana-8.4.3]# bin/kibana
Kibana should not be run as root.  Use --allow-root to continue.

[root@vm2 kibana-8.4.3]# su es
[es@vm2 kibana-8.4.3]$ bin/kibana
[2022-10-17T17:41:59.539-07:00][INFO ][node] Kibana process configured with roles: [background_tasks, ui]
[2022-10-17T17:42:06.604-07:00][INFO ][http.server.Preboot] http server running at http://localhost:5601
[2022-10-17T17:42:06.644-07:00][INFO ][plugins-system.preboot] Setting up [1] plugins: [interactiveSetup]
[2022-10-17T17:42:06.646-07:00][INFO ][preboot] "interactiveSetup" plugin is holding setup: Validating Elasticsearch connection configuration…
[2022-10-17T17:42:06.681-07:00][INFO ][root] Holding setup until preboot stage is completed.

i Kibana has not been configured.

Go to http://localhost:5601/?code=263178 to get started.
Allow connections from remote users:
[root@vm2 kibana-8.4.3]# vim config/kibana.yml
# To allow connections from remote users, set this parameter to a non-loopback address.
#server.host: "localhost"
server.host: "10.10.10.2"
Restart the kibana to reflect the change:
[root@vm2 kibana-8.4.3]# su es
[es@vm2 kibana-8.4.3]$ bin/kibana
[...]
Go to http://10.10.10.2:5601/?code=293334 to get started.
Connect Kibana to Elasticsearch
From the Browser, enter “http://10.10.10.2:5601/?code=293334“.
If you run into the following issue when to connect to elasticsearch server from kibana web UI, you can change the URL from “https://10.10.10.1:9200“ to “http://10.10.10.1:9200“ for testing purpose.
[2022-11-09T10:55:02.691-08:00][ERROR][plugins.interactiveSetup.elasticsearch] Unable to connect to host "https://10.10.10.1:9200": write EPROTO 139880583923648:error:1408F10B:SSL routines:ssl3_get_record:wrong version number:../deps/openssl/openssl/ssl/record/ssl3_record.c:332:
Use Dev Tools in Kibana
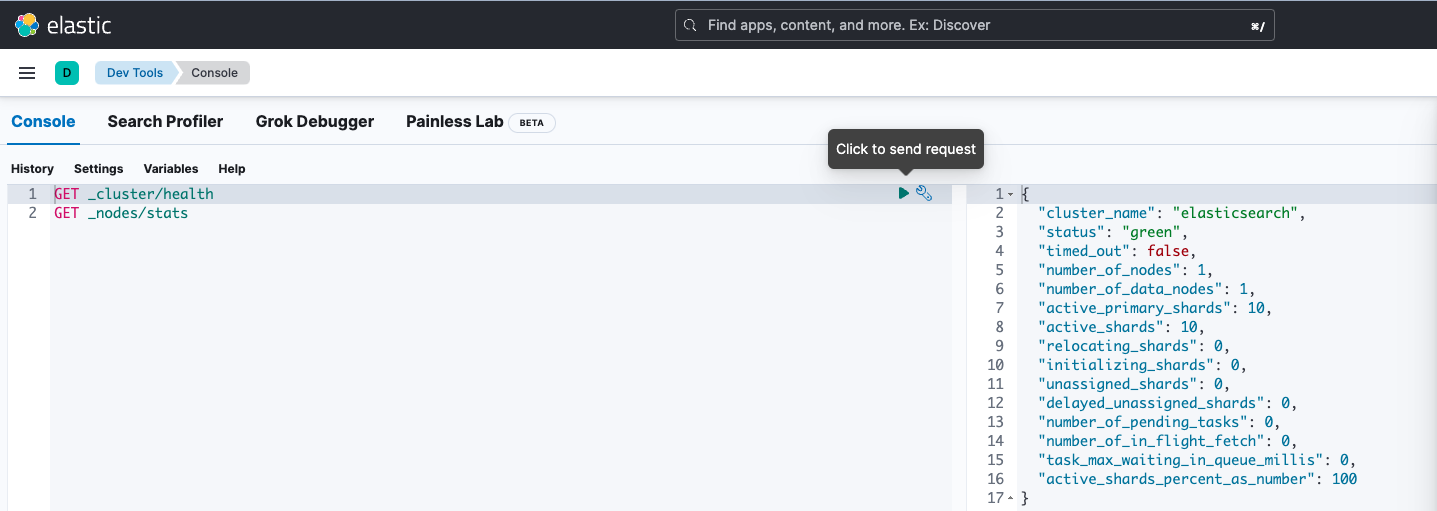
GET _cluster/health
{
  "cluster_name": "elasticsearch",
  "status": "green",
  "timed_out": false,
  "number_of_nodes": 1,
  "number_of_data_nodes": 1,
  "active_primary_shards": 10,
  "active_shards": 10,
  "relocating_shards": 0,
  "initializing_shards": 0,
  "unassigned_shards": 0,
  "delayed_unassigned_shards": 0,
  "number_of_pending_tasks": 0,
  "number_of_in_flight_fetch": 0,
  "task_max_waiting_in_queue_millis": 0,
  "active_shards_percent_as_number": 100
}
GET _nodes/stats
{
  "_nodes": {
    "total": 1,
    "successful": 1,
    "failed": 0
  },
  "cluster_name": "elasticsearch",
  "nodes": {
    [...]
  }
}