dstat - A replacement for vmstat, iostat and ifstat
Introduction
dstat is a versatile tool for generating system resource statistics. It can be a replacement for vmstat, iostat and ifstat. It overcomes some of the limitations and adds some extra features.
Dstat allows you to view all of your system resources instantly, you can eg. compare disk usage in combination with interrupts from your IDE controller, or compare the network bandwidth numbers directly with the disk throughput (in the same interval).
Usage examples
Display statistics of major OS components:
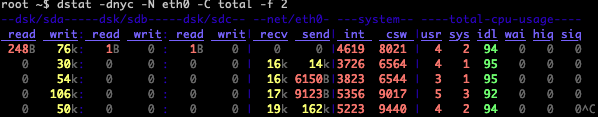
Relate disk-throughput with network-usage (eth0), total CPU-usage and system counters:
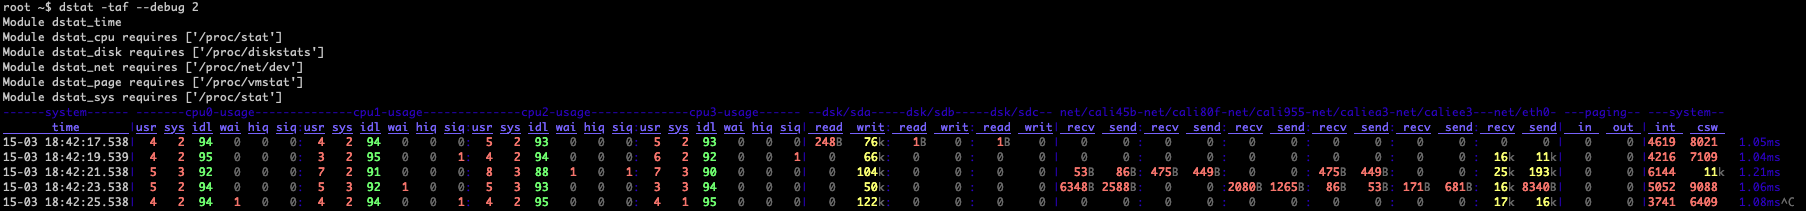
Check dstat’s behaviour and the system impact of dstat:
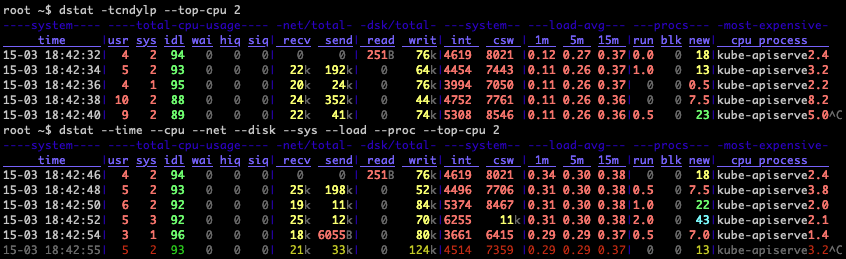
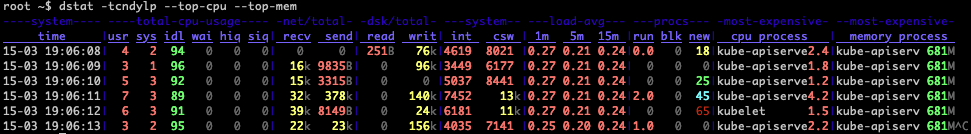
Use the time plugin together with cpu, net, disk, system, load, proc and top_cpu plugins:
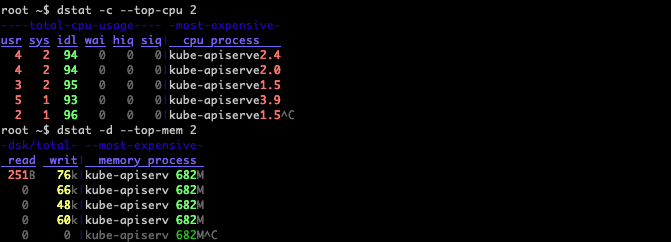
Display stats of process using most of the CPU or memory:
Display stats of process using most of the CPU and memory:
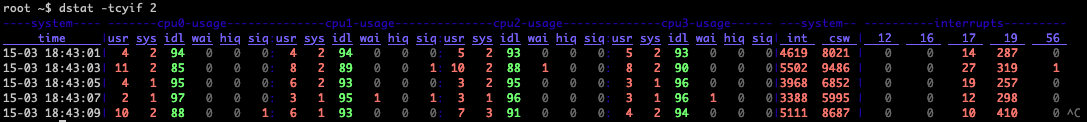
Relate cpu stats with interrupts per device:
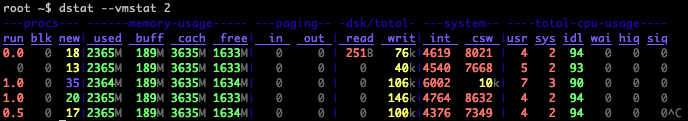
Display information that was to be displayed by vmstat tool:
Display the list of all plugins:
root ~$ dstat --list
internal:
    aio, cpu, cpu24, disk, disk24, disk24old, epoch, fs, int, int24, io, ipc, load, lock, mem, net, page, page24, proc, raw, socket, swap, swapold, sys, tcp, time, udp, unix, vm
/usr/share/dstat:
    battery, battery-remain, cpufreq, dbus, disk-tps, disk-util, dstat, dstat-cpu, dstat-ctxt, dstat-mem, fan, freespace, gpfs, gpfs-ops, helloworld, innodb-buffer, innodb-io, innodb-ops, lustre, memcache-hits, mysql-io, mysql-keys, mysql5-cmds, mysql5-conn,
    mysql5-io, mysql5-keys, net-packets, nfs3, nfs3-ops, nfsd3, nfsd3-ops, ntp, postfix, power, proc-count, qmail, rpc, rpcd, sendmail, snooze, squid, test, thermal, top-bio, top-bio-adv, top-childwait, top-cpu, top-cpu-adv, top-cputime, top-cputime-avg, top-int,
    top-io, top-io-adv, top-latency, top-latency-avg, top-mem, top-oom, utmp, vm-memctl, vmk-hba, vmk-int, vmk-nic, vz-cpu, vz-io, vz-ubc, wifi
Force float values to be printed:
root ~$ dstat --float 2
You did not select any stats, using -cdngy by default.
----total-cpu-usage---- -dsk/total- -net/total- ---paging-- ---system--
usr sys idl wai hiq siq| read  writ| recv  send|  in   out | int   csw
4.5 1.8  94 0.1   0 0.1| 251B 76.1k|   0     0 |   0     0 |4619  8021
2.3 1.1  96 0.1   0 0.1|   0  54.0k|15.9k 7215B|   0     0 |3497  6381
5.3 2.4  92 0.1   0 0.1|   0   112k|18.1k 17.4k|   0     0 |5323  9184
9.4 2.3  88 0.1   0 0.3|   0   116k|24.5k  193k|   0     0 |5370  9091
2.3 1.3  96 0.1   0   0|   0  82.0k|18.0k 10.6k|   0     0 |3448  6127 ^C
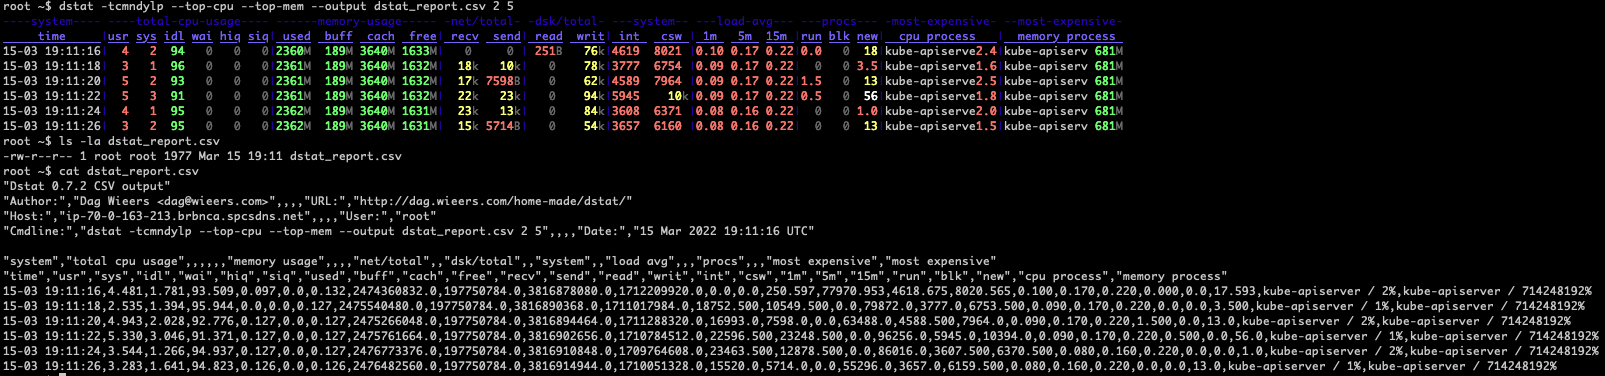
Display the time, cpu, mem, network, disk, system load, process stats with 2 seconds delay between 5 updates, and save output to a csv file:
Learn more about how the dstat is implemented:
Check out the source code here. Credit to Dag Wieers.